User Guide @May 6, 2010 11:48:09 AM
Interface Overview
What you see (Screen Layout)
Application and Login info
The window title holds the application and login information.
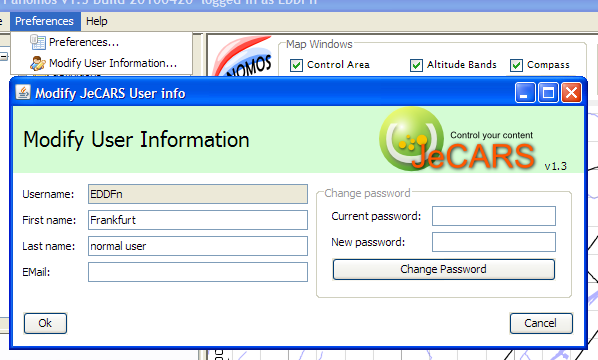
Modify User Information
To edit the user data, select the menu option Modify User Information. In this window the user can edit personal information. Please note that this option is not available for Guest users.
Basic Operations
Viewer Toolbar
The viewer toolbar contains the controls for the main viewer panel. The controls are distributed in four parts.
Map Windows
The main viewer panel as the possibility to show small inset windows. With the toggle buttons in the Map Windows part these windows can be controlled. The Default button reloads settings of last save preferences.
Printing
The print button will start the printing process, the process creates a PDF document and automatically a PDF viewer will be started, the printing itself should be done using the PDF viewer.
QuickInfo
The quickinfo part shows hovering information. When the user moves the mouse pointer over a track and keep it in the same position for some time the inforation will appear.
Zoom
Map Panel
In this panel (Drawing area) the map and map windows are shown.
To navigate in the mappanel use the left mouse to pan the map. To zoom in and out the mouse scrollwheel is used. Zooming in or out on the area can be accomplished using options of the viewer toolbar However, dragging the left mouse button while holding down the shift key can also perform zoom in. The selected area is shown with a rubber band rectangle while moving the mouse. The moment the user releases the button, the picture is re-drawn (refreshed) applying the current co-ordinates. It must be noted that whatever rectangle is selected, the longest side of the resulting area is matching the longest side of the selected rectangle.
Control Area
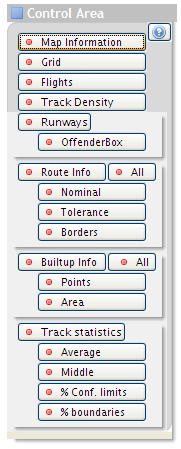
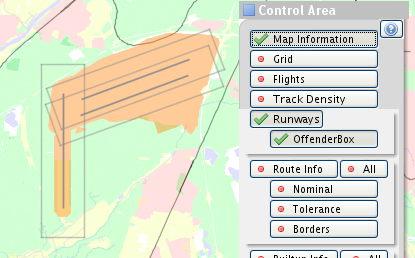
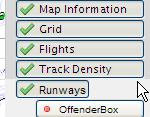
So-called layers represent the actual presentation. The various layers are related to a certain type of information that can be selected from the database or has been calculated. The user is able to control which data layer is to be presented, using the toggle buttons in the control area. A red dot means that the layer is disabled while a green checkmark indicates an active layer.- Map Information
- The geographical information of the selected area.
- Grid
- The grid of the map
- Flights
- The selected flight(s) for the query.
- Track Density
- To calculate density plots of tracks in the current flight selection.
- Runways
- The runways.
- OffenderBox
- Draw the offender box around the airfields
- The runways.
- Route info
- Route information
- Nominal
- The nominal route of the selected flight(s).
- Tolerance
- The tolerance routes of the selected flight(s).
- Borders
- The border (warning) routes of the selected flight(s).
- Nominal
- Route information
- Builtup Info
- The built-up areas with the co-ordinates as used in the calculations.
- Track statistics
- Average
- The statistic average flight of the selected flight-set.
- Middle
- The statistic middle of the selected flight-set.
- % Conf. limits
- The area in which (with P % certainty) the average flight track (of a similar flight-set)
- % boundaries
- The area within which P % of the flights in the selected flight-set can be found.
- Average
Altitude Bands
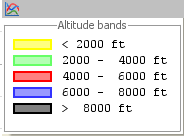
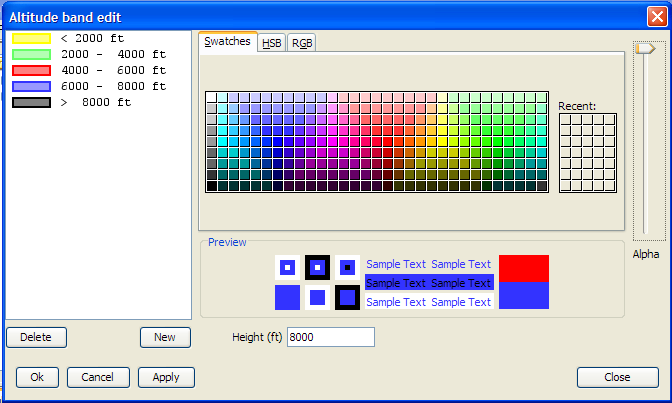
Altitude bands colouring enables the user to visualise, via colour coding, height bands in the map panel. The first band color will be used for all altitudes below the given level. The last band color will be used for all altitudes above the given level. In order to refrain certain altitudes from rendering a transparant color can be used.Altitude band edit
In order to edit the altitude bands, click with the left mouse button in the Altitude bands window on a altitude color band. All edits effect can directly being seen in the map panel.
- Editing of a color
- Select a color and use the Swatches, HSB or RGB tabs to select or create a new color, the color can also have an alpha factor which indicates the transparancy of the color, when the slider is at the top the transparancy is turned off.
- Adding a new altitude band.
- Click on the New button a new altitude band will be added at the end of the altitude range. On default it will have the value 99000 (or higher if this level already exists).
- Delete an altitude band.
- Select a altitude band and click on the Delete button.
- Cancelling the edits.
- To cancel the edits click on the Cancel or Close button.
- Accept the edits.
- Click on the Ok button.
Compass
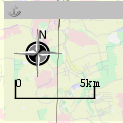
The compass is a transparent window which the compass icon but also the mapsize indicator.Map Layer Control
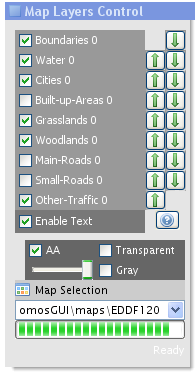
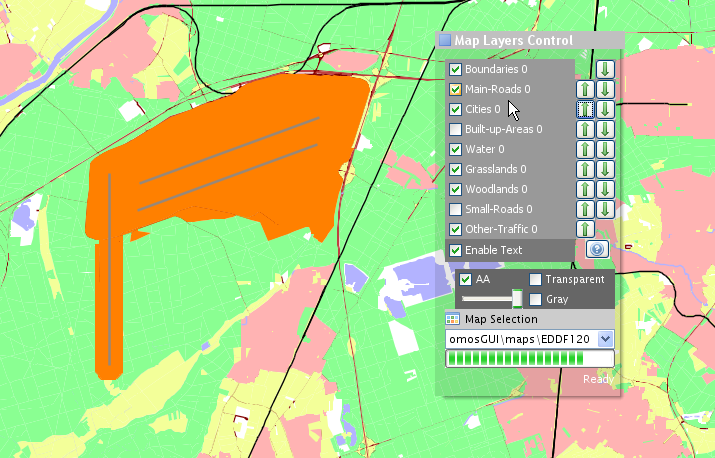
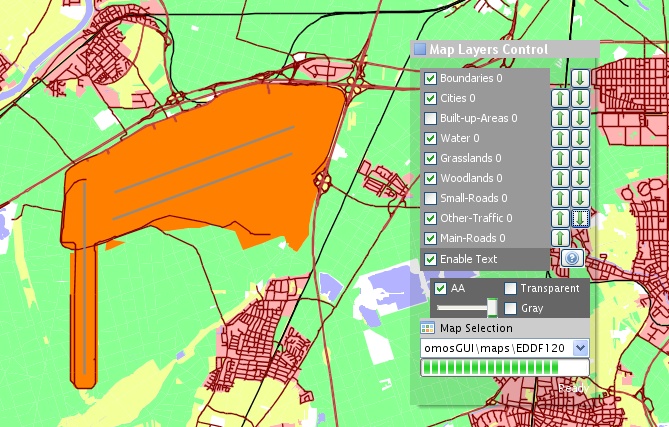
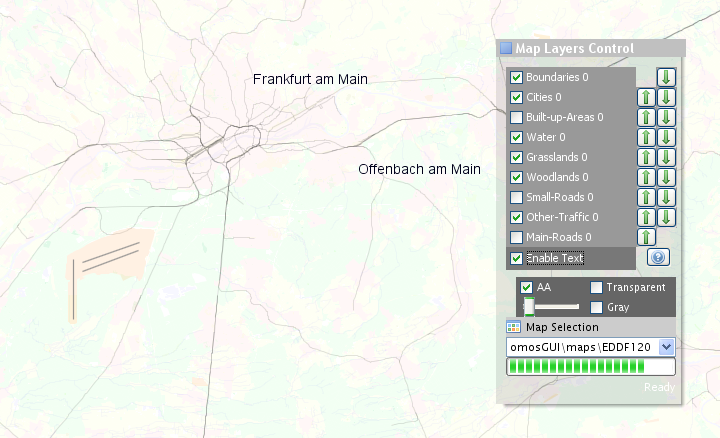
The Map Layers Control window controls the map layers.
The checkmark enable or disable the visual present of a map layer
Ordering map layers
Using the arrow buttons the ordering of the layers can be managed. The layers are drawn from top to bottom. The ordering effect is more present when the Transparent checkbox is deselected.
Enable Text
This checkbox enables the drawing of the text entries in the map.
Transparent
When this checkbox is selected all layers are drawn in a transparent way. In this way the layer ordering effects are more or less cancelled.
Alpha slider
Use the alpha to fade away the map. The utmost right position will disable the alpha effect. The effect can be use to let the flight tracks to stand out more, e.g. when printing the result.Gray
The option to present all colors in the map in grayscale.
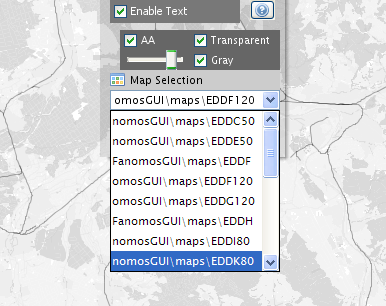
Map Selection
In the default situation the Map Selection part has no function other than showing the map loading progress. However for advanced users there is a possibility to support multiple map sources, which means that on the client multiple map variants are available. With dropdown list a different map can be selected.Profile Window
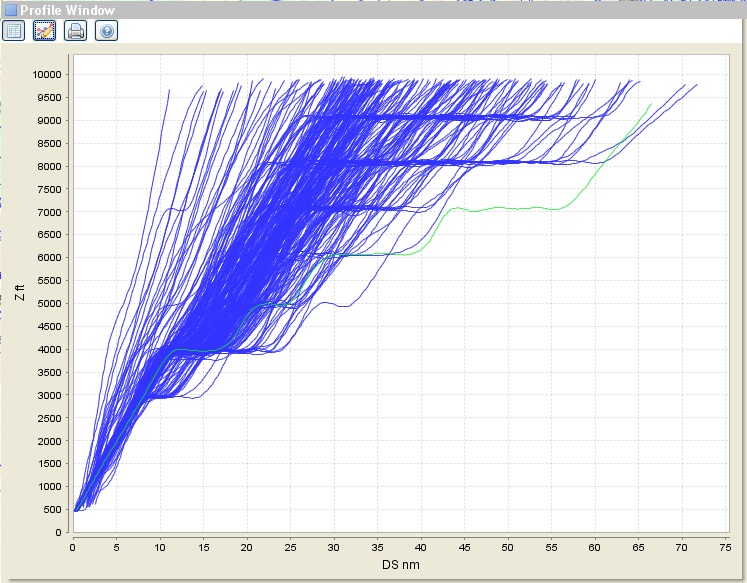
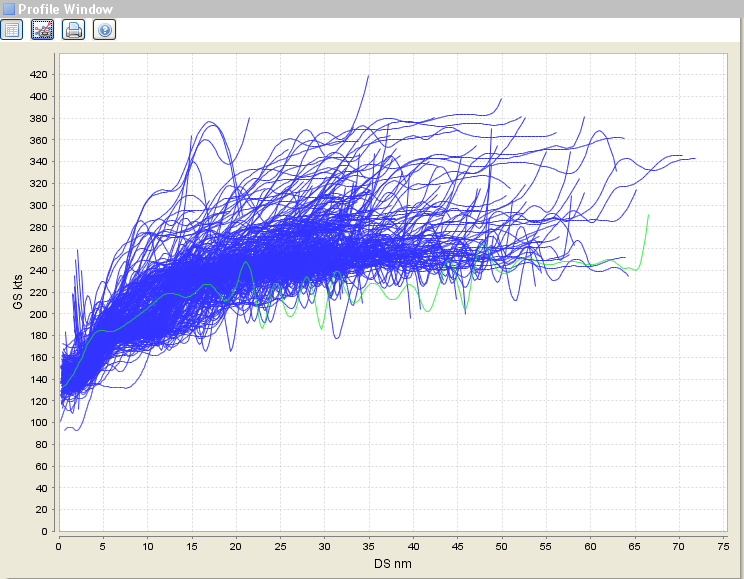
The profile window is a presentation window that shows flight profiles as an X/Y-plot using automatic and user-controlled scaling. Both the height- and groundspeed-profiles can be displayed for all flights in a flight-set or for a single flight selected. These profiles are automatically (re-)drawn after a new flight selection or new single flight selection.Query Flight Panel
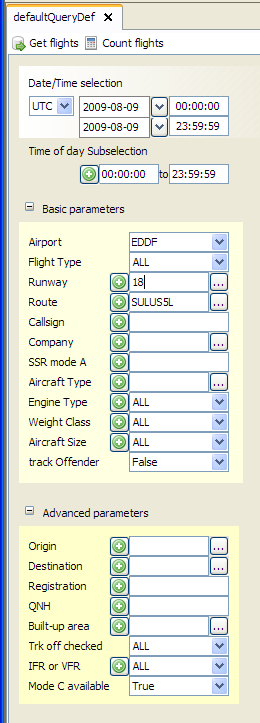
Flight Selection Panel
This window contains a scrollable list of flights of the current flight set.
Print flight selection list
The current query result set shown in the selection list will be printed to a PDF document ready for print.
Select Flight selection mode
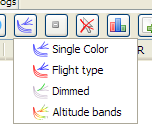
Flight track coloring
Altitude values
Deselect flight selection
The current selected flight(s) are deselected.
Flight statistics
Open the flight statistics calculation dailog
Flight plan and track export
Remove flights from the result set
Use selected flight as result set
Track density
Property Panels
Aircraft Property Panel
Airport Property Panel
Builtup Area Property Panel
Part of the flight track offender check procedure is the check whether the flight track flies over a (at least one) built-up area, below a prescribed height limit. To enable this, for each dataset, identified by a name, height limits (for day and night period) must be specified. Built-up area selection also is part of the flight selection process.
Edit Builtup Area Points
Flight Property Panel
Radar Property Panel
Route Property Panel
Route Base Property Panel
Route Segment Property Panel
Runway Property Panel
Calculations
Flight Statistics
The Flight statistics dailog is opened by pressing the statistics button in the flight selection list window.
Track Density
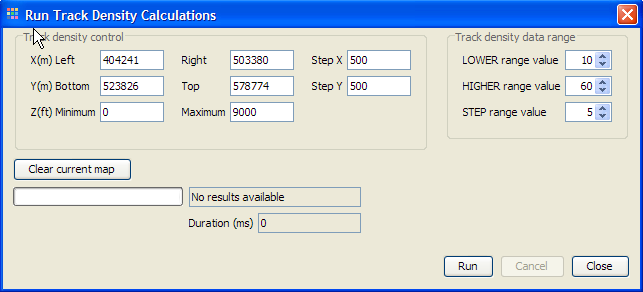
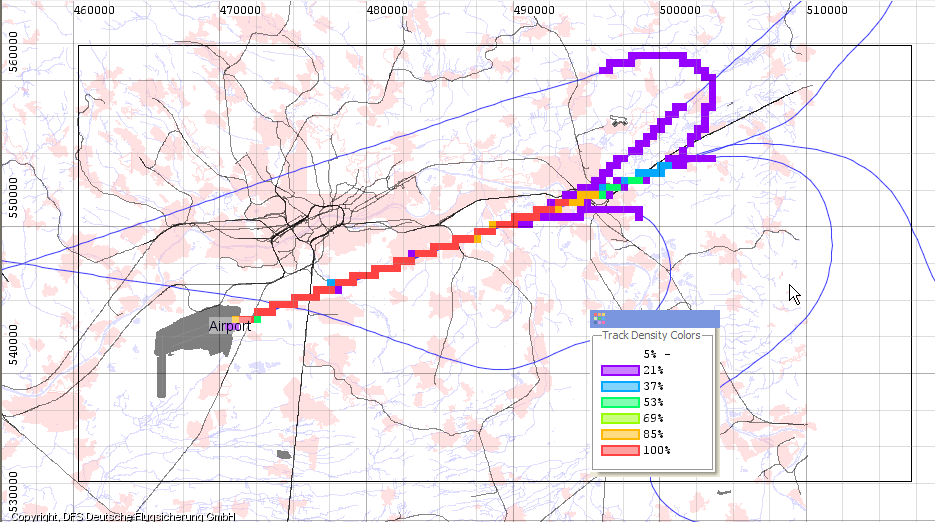
The Track Density button is used to open the Track Density calculation dialog. The calculation is done using the current set of flights. The track density results represent the number of flights passing through a grid-cel; the results are expressed as percentages of the current set of flights.
The Track density control part defines the grid area. The initial values represent the current visible part of the map at the time when the dailog was opened. These values can edited. The Z value filters in which height interval the density values are calculated. The X- and Y-values define the dimensions of the grid. Step X and Y defines the gridcell size in meters. To start the calculate press the “Run” button
Viewing the Track Density results
In order to view the track density result the “Track Density” layer must be enabled in the “Control Area”.
The grid area is marked with a black rectangle, and there is an extra Track Density Colors window added.
Using the controls in the “Track density data range” in the dailog the on screen picture can manipulated.
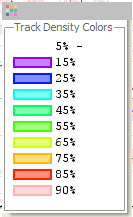
The LOWER, HIGHER range value (in percent) defines the visible interval range. The STEP range value defines the percentage step before change the color. The number of color intervals as calculate as follows; (HIGHER-LOWER)/STEP rounded up.
For example the shown color legend is the result of LOWER value 5, HIGHER value 90 and STEP value is 10. The first “purple” band show the density 5%-15%. Only the last color can have a smaller range due to rounding issues.
To clear the current density the “Clear Current Map” button can be pressed.

